
RISK ACTUALLY
A holistic review of the recent changes in the distribution of risk across the financial system and their consequences for market structure in general and Liquidity Dynamics in particular.
INTRODUCTION
After a year in which “everyone won,” it would have been natural to start the new year with confidence, if not outright greed. As natural sceptics, we have always found that difficult. More recently, however, something has changed that makes it even harder: market structure.
Our primary concern is the impact these structural shifts may have on liquidity. Because this is, in our view, the most critical risk, we focus this paper on analyzing how market structure has evolved, rather than speculating on the potential catalysts that could trigger a systemic shock. In any case, regardless of the trigger, the consequences for asset prices are likely to be similar.
It is also more robust to analyze observable, existing dynamics and draw conclusions from them than to attempt to predict specific future events in an increasingly uncertain and rapidly changing world. That said, there is no shortage of potential catalysts. As of March 2026, we remain cautious on AI, private credit, energy shocks, loss of confidence in central banks, major cyberattacks, and, of course, the unknown unknowns.
Our central thesis is that the past five years have seen seven unprecedented trends that together have dramatically changed the face of global markets. In this paper we identify these trends and study their consequences for market structure. One feature of the market structure that is always front and center for ADAPT IM is liquidity. However, we don’t believe spot liquidity (right here, right now) is the most relevant notion. Liquidity is fickle. Like an umbrella, what really matters is that it is available when you need it, not when the sun is shining. We therefore focus on the way liquidity changes and reacts to shocks and shifts in the market or volatility regime. This is what we call the Liquidity Dynamics.
Our analysis suggests that recent changes have contributed negatively to the Liquidity Dynamics for each of the seven trends mentioned above. This is extremely worrying. While our analysis of the consequences is our own and can be contested, one fact is not: the financial system is now entirely different from what it was five years ago and even more so from what it was ten years ago. We are therefore venturing into uncharted territory. That alone should be cause for caution.
In our analysis, we divide market participants into two categories: Stabilizers and Fragilizers. Stabilizers participate in maintaining a healthy and robust market structure. They tend to be contracyclical, to have a long-term investment horizon, or to carry responsibilities beyond immediate profitability. As a result, they provide liquidity in times of need and hence contribute positively to Liquidity Dynamics. In this category, we include fundamental managers, banks, and sovereign entities such as governments and central banks.
Fragilizers, on the other hand, increase concentration risk and participate in speculative behavior. They often play an important role in the virtuous circles that lead to asset bubbles. Conversely, they also act as a transmission mechanism in vicious circles on the way down. Some of them can contribute to local equilibrium through buy-the-dip strategies or to local liquidity through market-making. But because they’re procyclical, have a short investment horizon, or solely focus on immediate profitability, they stop offering liquidity in times of crisis and may even demand it. Fragilizers all have a negative contribution to the liquidity dynamics. In this group, we include private assets, passive investment, multi-strategy funds, non-committed liquidity providers, and retail investors.
We want to make it clear that we are not arguing that any of these Fragilizers, taken independently, are inherently negative for market structure, or that they should not exist. On the contrary, we are firm believers in the benefits of markets and freedom for the greater good. We are convinced that speculators play a crucial role in keeping markets fair, transparent, liquid, and efficient. A healthy market requires a balance between speculators and long-term fundamental investors. It is this balance that we question today. Over the past ten years, and more quickly over the past five, the importance of Fragilizers has expanded significantly. At the same time, the capacity of Stabilizers has steadily receded, largely through the seven trends examined in this paper. The dangers arising from the current imbalance between these two categories are the central focus of this paper.
-
1.a Evidence
1.b Consequences
1.b.i Greater Beta and larger exposure to tech
1.b.ii Increased opacity and more risky deals
1.b.iii Contagion risks to the broader financial system -
2.a Evidence
2.b Consequences
2.b.i Technically driven valuations increase concentration
2.b.ii Greater concentration can lead to volatility shocks
-
3.a Evidence
3.b Consequences
-
4.a Evidence
4.a.i Non-committed liquidity providers at all-time high
4.a.ii Committed liquidity providers at all-time low
4.b Consequences
4.b.i The illusion of liquidity masks great risk to Liquidity Dynamics
2.b.ii Prime Brokerage: The contagion channel between non-committed liquidity providers and banks
-
5.a Evidence
5.a.i Evidence in volumes
5.a.ii Evidence in derivatives parameters
5.b Consequences
5.b.i BTD: a local stabilizer but a growing risk to Liquidity Dynamics
5.b.ii Contagion risks from Wall Street to Main Street
-
6.a Evidence
6.a.i Rising level of debts
6.a.ii Erosion of central banks’ credibility
6.b Consequences
6.b.i Higher rates make new debt issuance and budget deficit more dangerous
6.b.ii Credibility destruction curbing central banks’ power
-
7.a Evidence
7.a.i Heightened derivatization of the world
7.a.ii Increasingly complex ETFs
7.a.iii AI Financing overengineering at all-time high
7.a.iv PIK
7.b Consequences
7.b.i Derivatization indicates a more speculative mood, contributing to greater fragility
7.b.ii Heightened ETF complexity increases market fragility
7.b.iii Lower transparency in AI complex financing makes debt markets more risky
7.b.iv PIKs worsen the risk
SECTION 1: PRIVATE ASSETS AT ALL-TIME HIGH
Any study of liquidity over the past decade must begin by confronting the elephant in the room: Private Assets. Never in recent history have investors allocated such a large share of their portfolios to private markets, while simultaneously selling liquidity premium so cheap. This first trend in our study has profound implications for liquidity, extending well beyond its own dynamics.
1A. EVIDENCE
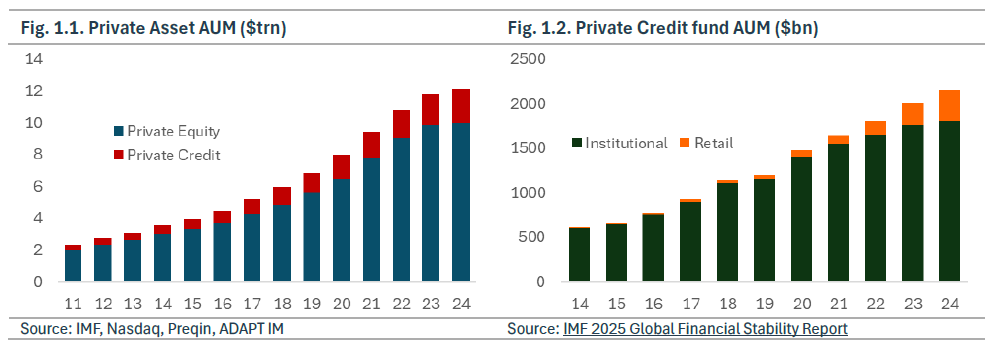
Figures 1.1 and 1.2 show the spectacular, broad-based growth of private assets. Traditional private equity allocations remain strong, but new engines of growth have emerged. On the supply side, private credit now drives expansion, often through riskier assets. The Financial Times reports that private credit firms bought nearly 14 times more consumer debt in 2025 than in 2024, including unsecured credit-card and “buy now, pay later” loans which are typically unsecured. On the demand side, retail investors now represent up to 15% of private credit funds’ investor base.
1B. CONSEQUENCES
1B.i. Greater Beta and larger exposure to tech
Rather than enhancing portfolio diversification and resilience, the rise of private assets often amounts to a doubling of beta exposure, without the same certainty on the real quality of the assets. In practice, allocators gain essentially the same underlying exposure to economic growth as in public markets, including in the sectorial allocations, but with significantly less transparency, scrutiny and liquidity.
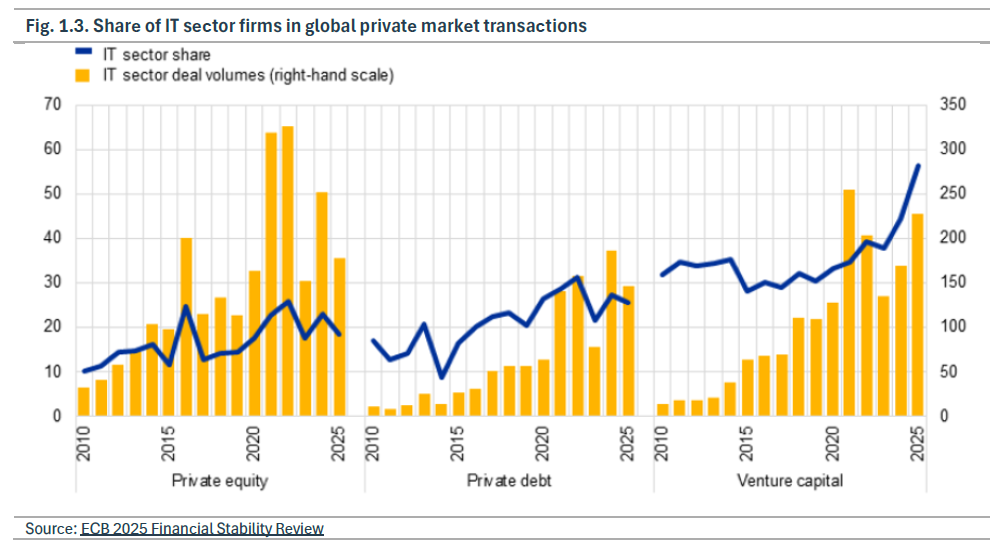
Besides, private markets display a sector concentration similar to that of public markets, particularly in information technology. For allocators, this translates into increased sector risk across the overall portfolio. The ECB’s 2025 Financial Stability Review highlights the growing share of IT-related transactions in private markets (Fig. 1.3). As a result, investors may find themselves doubly exposed to the same sector through both public and private allocations, amplifying concentration risk rather than achieving genuine diversification.
1B.ii. Increased opacity and more risky deals
Private assets face far less scrutiny and fewer transparency requirements than public markets. While this opacity is intrinsic to the asset class, the recent acceleration in deal activity appears to be eroding due diligence standards. John Graham, CEO of the Canada Pension Plan Investment Board, told the Financial Times that private credit transactions are now executed so quickly that investors often lack adequate time for proper due diligence. This was highlighted by ECB Supervisory Board member Elizabeth McCaul, who stated that “we are trading transparency for speed […] that may be fine in good times, but in a downturn, it leaves policymakers flying blind”. The result is a weaker understanding of underlying exposures and a greater risk of mispriced credit risk within portfolios.
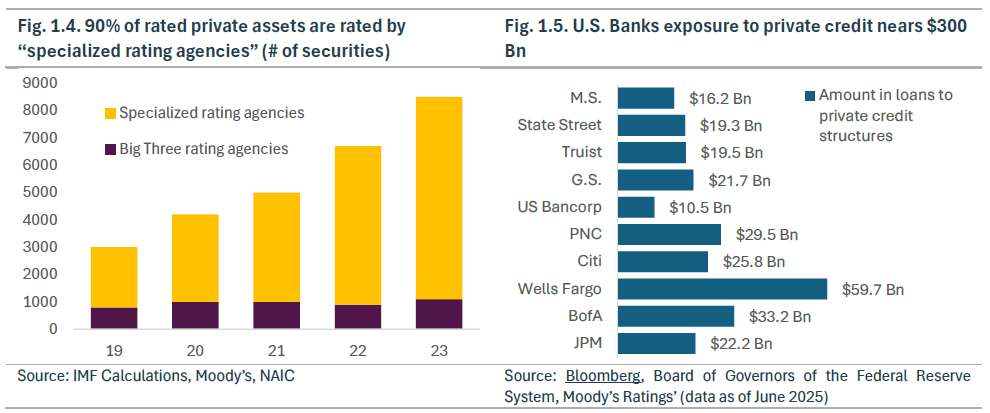
This concern is echoed by the IMF, which notes that the number of privately rated securities has nearly tripled since 2019. The major rating agencies have kept their volumes broadly stable, meaning that almost all the increase comes from newer agencies focused on private assets. As shown in Fig. 1.4, this shift raises questions about the consistency, comparability, and overall rigor of risk assessment in private markets.
The shift towards private markets increases opacity for the entire financial system, due to limited data availability. The indicators typically used by regulators to identify emerging crisis risks, such as excess leverage or the quality of collateral, are not always accessible in parts of the non-bank sector. The IMF has highlighted broader information gaps across non-bank financial institutions (NBFIs), which are generally less regulated than banks and subject to different reporting requirements, while the ECB noted that its analysis of the non-bank sector has at times been constrained by insufficient data (source: Bloomberg, Predicting Next Crash Made Harder as Private Markets Obscure Data). The impact of NBFIs will be discussed further in Section 4.
1B.iii. Contagion risks to the broader financial system
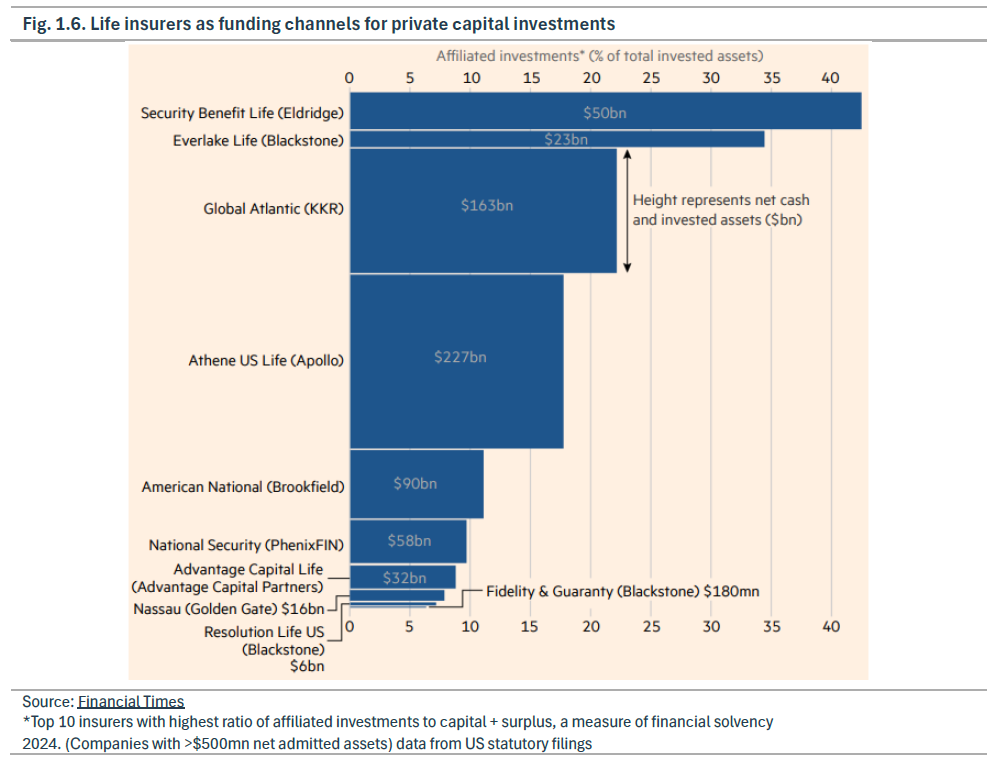
Private credit can act as a transmission channel to the broader financial system through its links with other actors. Bloomberg reports that U.S. banks had extended about $300 billion in loans to private credit funds and other investment vehicles that originate private loans (Fig. 1.5), out of an estimated $500 billion in total loans. While the OFR notes that most private credit funds are only moderately leveraged, it also highlights that 5% has a leverage ratio above 3.5. In the event of defaults, this highly leveraged segment could create stress for the industry as a whole and, in turn, for banks. (source: OFR Brief: Measuring counterparty exposures to private credit; Bloomberg, Private credit’s‘ back leverage’ is another pain point for funds). Second, life insurers could become a transmission channel as private capital groups increasingly use them to fund lending (Fig. 1.6). In some cases, they even acquire them outright, as illustrated by Apollo’s control of Athene, KKR’s ownership of Global Atlantic, and Aquarian’s acquisition of Brighthouse. The Financial Times reports that this shift has gone hand in hand with growing exposure among life insurers to Level 3 assets — that is, assets whose valuation relies on models rather than observable market prices. For example, they reached 36% of Athene’s total assets in the third quarter of 2025 and 30% at Global Atlantic, up from 12% and 10% in 2021 (source: Financial Times, How insurance became the lifeblood of private credit). Taken together, these links suggest that private credit is not a stand-alone segment of the private markets, but an increasingly interconnected one whose stresses can be transmitted to other financial actors.
Private assets at an all-time high: a growing fault line in market liquidity.
Over the past five years, investors have poured an ever-larger share of their portfolios into private assets, effectively surrendering one of the most valuable premia available: liquidity. In a world flush with cash, locking capital away for years looked like a free lunch. It was not. When conditions tighten, the cost becomes obvious. Private assets cannot be sold, resized, or reallocated. Risk cannot be cut, capital cannot be redeployed, and flexibility disappears exactly when it is needed most. This dynamic also places significant pressure on the liquid portion of portfolios. The “liquid half” is forced to shoulder the burden of providing liquidity, not just for itself but for the entire portfolio, amplifying stress in public markets and further weakening overall market liquidity.
SECTION 2: PASSIVE AT ALL-TIME HIGH
Turning to public markets, this section examines a second major trend: the rise and dominance of passive investing over active investing. In our framework it represents the second win of a Fragilizer over a Stabilizer.
2A. EVIDENCE
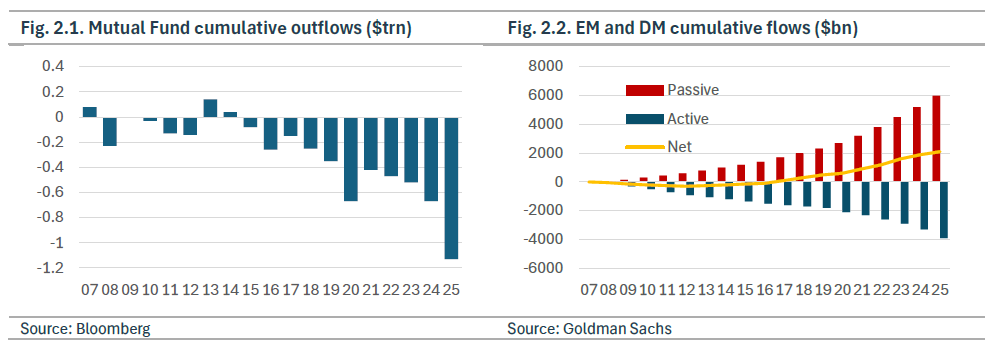
Over the past decade, passive investing has risen steadily while active management has experienced a sustained decline. Bloomberg Intelligence estimates that between 2010 and 2025, investors redeemed a cumulative 1 trillion dollars from active equity mutual funds alone (Fig. 2.1). A broader industry analysis by Goldman Sachs in its 2026 Global Macro Outlook found that since 2007, investors have withdrawn nearly 4 trillion dollars from active funds while allocating approximately 6 trillion dollars to passive vehicles (Fig. 2.2).
The ECB reports a similar pattern, noting that passive equity funds accounted for nearly 60 percent of total AUM in 2024.
2B. CONSEQUENCES
2B.i. Technically driven valuations increase concentration
The shift to passive investment has profound technical and fundamental repercussions. From a fundamental standpoint the bottom up and micro rationale of owning a stock for its own merits is replaced by ownership for the sake of being long and tracking the index. In our view, obsessive benchmarking, particularly to the S&P 500, means that investors following a passive strategy are relatively estranged from the stock they own. The success of passive investment has been built on several pillars such as low cost, strong performance and easy implementation of a diversified exposure. While we don’t see any reason why costs of passive investment should pick up, future performance might be different from the past decade of secular bull market. Furthermore, given the extremely high level of concentration among equity indices we argue that the diversification benefits have receded.
This ECB report mentioned in 2.a highlights the risk of higher equity market concentration due to the behavior of passive funds who overweight the largest stocks to minimize the tracking error when replicating their benchmark. In short, passive investment mechanically reinforces the already extreme concentration in a small number of large stocks (cf. Box 1). In addition, the rule-based nature of passive strategies tends to concentrate liquidity around the market close, when these funds typically rebalance their holdings.
The decline of active management also reduce corrective forces to this vicious circle. Indeed, when active managers are strong, marginal pricing remains valuation-sensitive and capital is reallocated counter-cyclically, that is away from stretched large caps and toward undervalued companies. As passive share rises, this stabilization mechanics weakens, favoring market concentration.
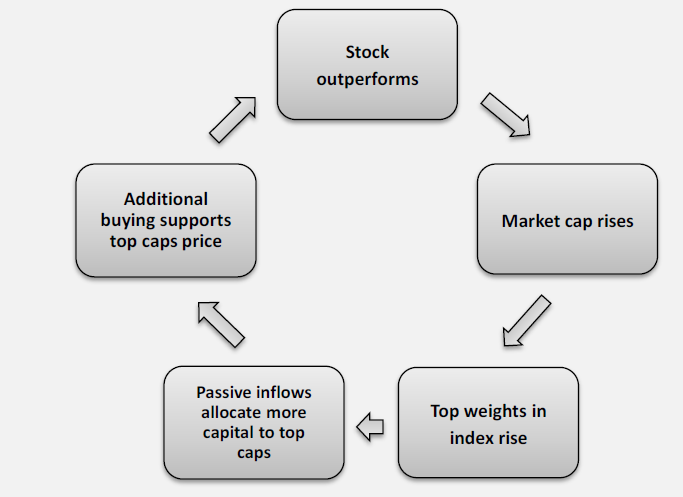
BOX 1. Passive mechanically acting on concentration
Passive investment strategies track and replicate broad market indices rather than selecting individual stocks based on fundamentals. This means that when an investor allocates capital in a passive fund, the fund buys the index constituents proportionally to their weight in the index — often given by the market cap — hence larger firms receive more inflow than the smallest, increasing their market capitalization relative to the smaller ones. Over time, this mechanism magnifies the dominance of the largest stocks and cyclically increases the inflow in the largest caps.
The passive investment mechanics: a self-feeding loop
2B.ii Greater concentration can lead to volatility shocks
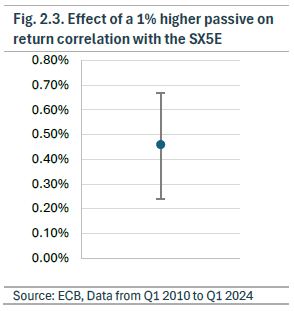
The same ECB study also shows that increased allocation to passive investment may “increase co-movement among stock returns” which translates into potentially higher volatility. More precisely, the ECB estimates that return correlation in the EURO STOXX Index increases by 0.45% for each 1% share of passive ownership (Fig. 2.3).
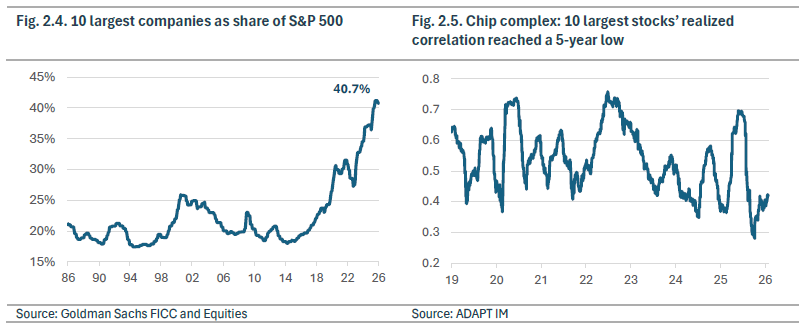
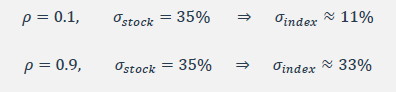
In last year’s update, The End of History Illusion, we highlighted the ultra-high level of concentration in equity indices. We also pointed out the apparent disconnect between the fundamental interdependence (Figure 2.6 shows the business relationship between these firms) of the AI complex and the actual low realized correlation between the stocks in this complex. Both metrics have gone worse. As shown in Figure 2.6, this complex has grown by $7 trillion since our original publication. This unprecedented level of concentration (Fig. 2.4) remains one of markets’ key vulnerabilities, especially when factoring in the ultra-low level of realized correlation (Fig. 2.5) and its potential effect on volatility (cf. Box 2).
BOX 2. The mathematical intuition: Index volatility when correlations come back
Low correlations are a key feature of the current market regime and the main source of low systemic volatility. Index volatility will rise sharply if correlation spikes, even if individual stock volatilities remain stable. Suppose indeed we have an equally weighted index with stocks with average volatility and average pairwise correlation . The index volatility is:
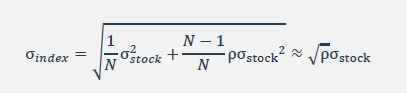
From this formula, the index becomes more volatile as correlation increases. An index such as the S&P 500 with initial single stock volatility at 35% and correlation 0.1 (current conditions) can see its volatility rise from 11% to 33% if correlation rises to 0.9, without any change to its underlying volatilities!
The rise of concentration and the level of correlation are not the only way to think about how passive can affect volatility. In A Model for Passive That Breaks the Market, Michael Green, Hari P. Krishnan and Stephan Sturm propose a stochastic model for the impact of passive share on equity index returns. The idea behind that model is to take into account the mean-reverting corrective force provided by active managers. Indeed, active investing focuses on allocating more capital when the market or a security is undervalued and decreasing the allocation when it is overvalued. This helps bring prices back toward a fundamental value when markets are away from equilibrium. In this model, the index evolves as the combination of a drift term representing the corrective mean-reverting force and a diffusion term capturing volatility. The drift is proportional to the share of active investing and the gap between market price and fundamental value; hence, as passive ownership rises, the corrective force becomes mechanically weaker. The diffusion, in particular, increases as market prices fall relative to fundamental value, thereby increasing volatility in response to market shocks and reflecting the typical behavior of higher volatility in low-price regimes. Under this model, instability in the markets becomes stronger and lasts longer because of a weaker mean-reverting corrective force.
Passive at an all-time high: herd behavior and concentration are detrimental to liquidity
As passive investing overtakes active management, technical flows increasingly dominate fundamental ones. A Fragilizer replaces a Stabilizer. Capital is allocated not because assets are attractive, but because being long has worked in the past. The consequences are clear: declining fundamental insight, rising concentration, growing complacency and higher volatility shock risk.
SECTION 3:
MULTI-STRATEGY AT ALL-TIME HIGH
The battle for the soul of the long-only investment community has sifted in favor of Fragilizers. Staying on the buy-side but shifting away from long-only to now look into alternatives, we study the meteoric rise of Multi-Strategy funds and its consequential detrimental impact on Liquidity Dynamics.
3A. EVIDENCE
In their 2025 landscape of Multi-Manager Hedge Funds, Goldman Sachs concludes that large multi-strategy platforms have reached new highs in assets under management, risk deployed, trading volumes and headcount.
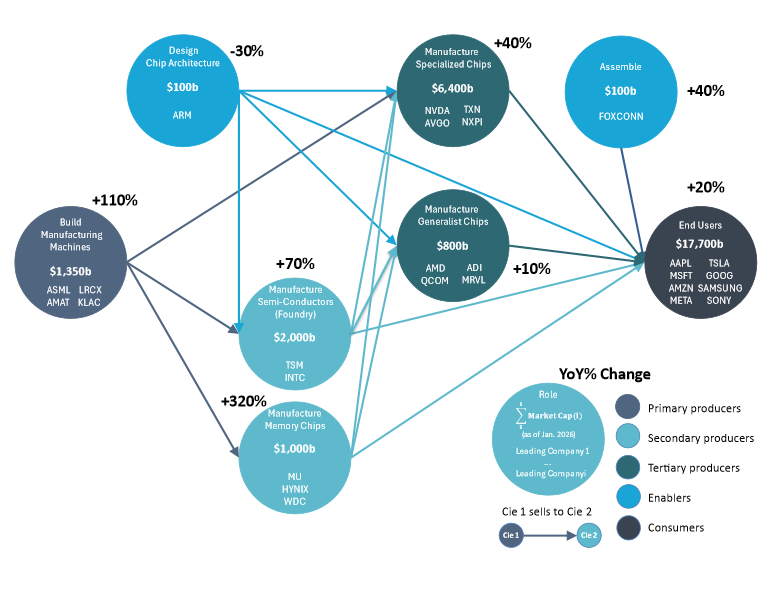
Over the past 15 years, their expansion has significantly outpaced the broader hedge fund industry, with multi-strategy assets growing roughly twice as fast as the rest of the sector. Far from slowing down, this momentum accelerated further in 2025, with these investor-favored funds growing about four times more than the remainder of the industry. (Figures 3.1 and 3.2)
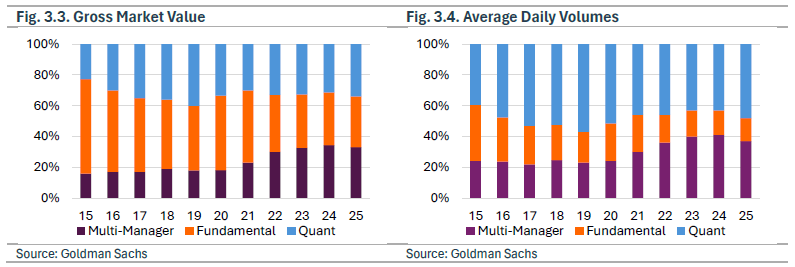
Today, multi-manager funds account for roughly one third of hedge fund gross market value deployed in US equities and represent 37% of average daily trading volumes. (Figure 3.3 and 3.4)
This scale is supported by a substantial workforce. Around one-third of hedge fund employees now work at multi-strategy platforms, which collectively employ approximately 24,000 people.
3B. CONSEQUENCES
Multi-manager funds, supported by their consistent performance, have increasingly positioned themselves as intermediaries between hedge fund allocators and underlying portfolio managers. For the former, they remove the burden of due diligence, strategy understanding, and portfolio construction. For the latter, they eliminate the need to build institutional infrastructure, run a firm, and market a strategy. This has elevated them to a systemic force within the industry, with meaningful implications for financial markets.
A defining feature of these platforms is their strict and highly effective risk management. It allows them to rapidly scale down exposure to underperforming managers and, thanks to the breadth and diversification of strategies on their platforms, contain losses at the aggregate portfolio level.
This discipline has enabled them to navigate the past decade without major disruptions. However, at their current scale, the very risk model that underpinned their success could turn them into amplifiers of volatility in a severe or prolonged market downturn.
To be applied across a wide range of strategies, this framework must be highly standardized. This naturally fosters concentration and, ultimately, crowding. With a growing share of industry assets managed under similar models, utility functions, and risk constraints, the risk of asymmetric liquidity conditions increases. In periods of stress, many managers may attempt to exit similar positions simultaneously, amplifying market moves and exacerbating shocks.
What is even more worrisome is that the risk of a large multi-strategy pod washout is increasingly likely during periods of equity market reversal. BNP’s 2026 Hedge Fund Outlook shows that by the end of 2025, the one-year correlation between MSCI World and hedge fund performance reached 92%. At a more granular level, multi-strategy funds stand out, with correlation to equities surging to 88% in 2025, up from 28% over the 2021-2025 period. This could prove the perfect storm for an allocator’s portfolio with significant explicit and implicit equity beta.
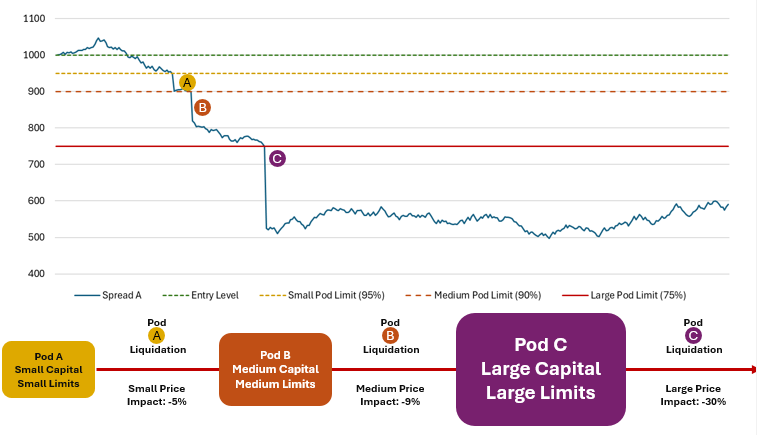
Box 3. The butterfly effect: how a small pod unwind can trigger a broader market washout.
Consider multiple multi-strategy pods positioned in the same dislocations, a small, a medium, and a large pod. Each receives capital and risk limits according to its size, with larger pods allocated more capital and wider risk limits. Given that all three target the same dislocation, a liquidation of the smaller pod can trigger a chain reaction with consequences for larger pods and ultimately systemic market impact if the largest pod or pods are liquidated.
The rise of multi-strategy funds is increasing the risk of large-scale market dislocations and making markets more fragile.
Gradually replacing independent hedge funds, multi-strategy platforms have become the new systemic middleman between allocators and portfolio managers. Their success, built on diversification, margin efficiency, and tight risk management, comes at a cost: reduced market resilience.
A largely homogeneous, loss-driven risk framework has replaced a previously diverse ecosystem of independent firms with heterogeneous risk appetites and reaction functions. As a result, the risk of coordinated unwinds across multi-strategy funds has risen materially and is becoming harder to ignore.
SECTION 4:
NON-COMMITTED LIQUIDITY PROVIDERS AT ALL-TIME HIGH, COMMITTED AT ALL-TIME LOW
The hedge fund industry is not the only one being reshaped by new entrants from the Fragilizer family. The market-making ecosystem has also seen the rise of new titans, steadily capturing large portions of the business once dominated by traditional liquidity providers and market Stabilizers
In this section, we examine the rise of market makers and quant funds, which we classify as non-committed liquidity providers, alongside the relative decline of banks as committed providers of liquidity.Once again, Liquidity Dynamics emerges as the primary casualty of this shift in market structure.
4A. EVIDENCE
The rise of market makers and the relative decline of banks are two sides of the same coin. Following major regulatory shifts, market makers rapidly stepped into the businesses that banks were forced to retreat from. This has created a tightly knit relationship between the new and old Wall Street titans, with potentially dangerous channels of contagion running through lending and prime brokerage services.
4A.i. Non-committed liquidity providers at all-time high
For the purpose of this paper, we classify market makers and quant funds as non-committed liquidity providers. While distinct in structure, market makers deploy their own capital whereas quant funds primarily deploy client capital, they share a critical feature: their provision of liquidity is opportunistic rather than committed. What appears to enhance liquidity in normal conditions can quickly evaporate under stress, in stark contrast to how banks provide liquidity.
Market makers have become central to modern financial markets, yet they operate with limited transparency and accountability. Unlike banks, which are deeply embedded in the real economy through lending and continuous intermediation, market makers can withdraw from markets almost instantly, with minimal reputational or regulatory consequences.
Quant funds further amplify this dynamic. Through high-frequency and systematic strategies, they often account for a significant share of daily trading volumes. But unlike banks, which monetize intermediation, quant funds monetize signals. When volatility rises and signals break down, liquidity is no longer provided, it is withdrawn.
Historically, trading was dominated by major investment banks, which acted as counterparties and liquidity providers for both institutional and retail investors. Post-crisis regulation, combined with the electronification of markets, created space for specialized electronic market makers to expand aggressively. Their revenues are now comparable to the trading divisions of leading global banks. As illustrated in Fig. 4.1, the combined revenue of Jane Street and Citadel represents nearly one third of the total trading revenue generated by the five largest US investment banks.
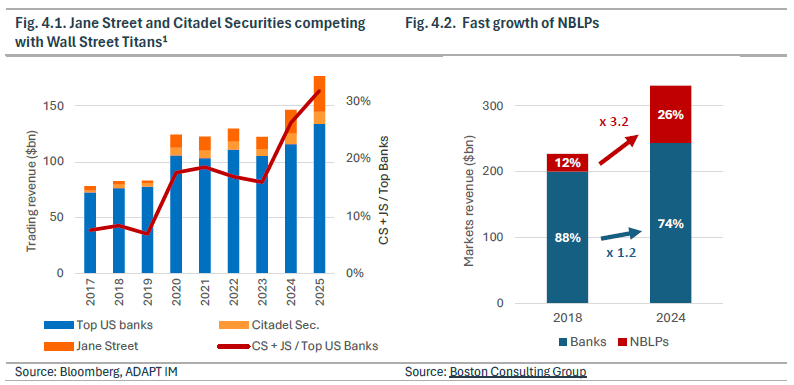
This shift is also reflected in broader industry data. According to the Boston Consulting Group’s Capital Markets & Investment Banking Update for 2024 and 2025, Non-Bank Liquidity Providers (NBLPs) — a category that includes market makers and proprietary trading firms — now account for roughly one quarter of the global market revenue pool, up from 12 percent in 2018 (Fig. 4.2).
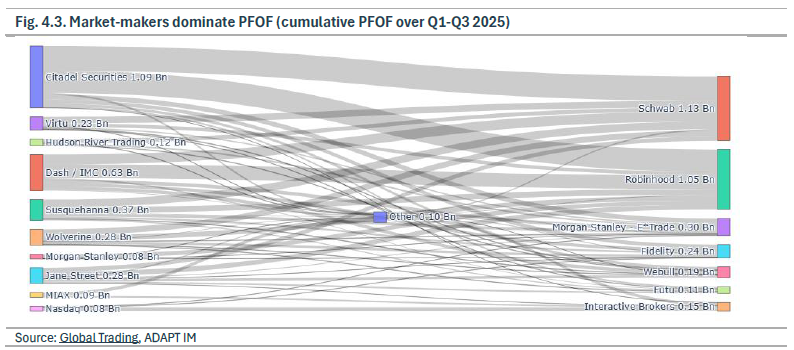
The domination of market makers in the retail trading segment is total, as evidenced by Payment for Order Flow (PFOF) disclosures displayed in Figure 4.3. Under this system, market makers compensate retail brokers for directing client orders to them, generating revenue through the resulting market-making activity. This practice has raised concerns, particularly around potential conflicts of interest in which brokers may prioritize PFOF revenue over securing the best execution price for their clients. Reflecting these concerns, PFOF will be prohibited in the European Union from 2026 onwards (source: ESMA).
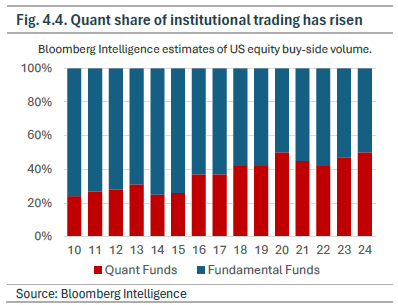
Quant funds have become a defining force in the new market structure, according to Bloomberg Intelligence estimates, they now account for half of the equity volume among buy-side funds, up from 25% ten years ago (Fig. 4.4). Their growing footprint creates the impression of abundant liquidity, but this liquidity is conditional and highly pro-cyclical. far more fragile than headline volumes suggest.
4A.ii. Committed liquidity providers at all-time low
In the aftermath of the 2008 crisis, banks faced substantially higher regulatory requirements and are now far better capitalized than they were twenty years ago. Although they remain key providers of liquidity and funding, stricter regulation has limited their ability to conduct certain activities. One example of increased scrutiny is the UMR regulation, which has impacted banks’ abilities to trade in OTC derivatives and has allowed new entrants to grab some of this business (see Box 4 below). Overall, non-bank financial institutions (NBFIs) have stepped in to fill the gaps left by banks and now account for the largest share of financial system assets on record. The rise of market makers and multi-strategy hedge funds, discussed earlier, illustrates how rapidly NBFIs have expanded into areas once dominated by banks.
Box 4. UMR: A multi-year regulatory calendar deeply affected OTC trading
Designed in the aftermath of the 2008 financial crisis, the UMR framework was intended to make banks’ OTC derivatives trading more resilient to counterparty risk. Before its implementation, banks and their counterparties exchanged collateral or margin bilaterally under negotiated agreements. While this mitigated some credit exposure, it could still lead to significant residual risk when collateral balances grew excessively during periods of market stress.
UMR addresses this vulnerability by introducing mandatory initial and variation margin requirements once exposures exceed defined thresholds. Under this framework, counterparties must post margin to an independent third party, reducing the build-up of bilateral exposures and strengthening the overall stability of the OTC derivatives market.
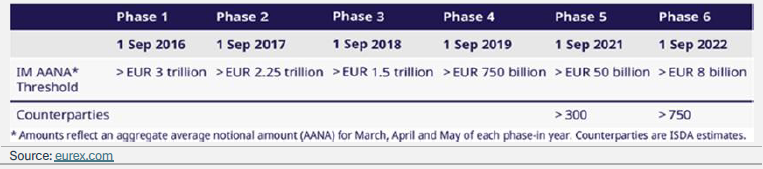
Although UMR was introduced nearly two decades ago, its real impact has only materialized over the past five years, aligning closely with the period we examine and the rise of non-committed liquidity providers.
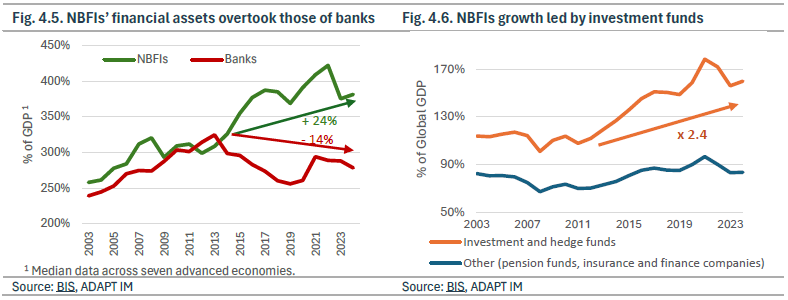
This shift is well documented in a recent report from the Bank for International Settlements (BIS). Figure 4.5 shows that across advanced economies and over the past fifteen years, the financial assets of NBFIs have grown significantly faster than those of banks relative to GDP. Figure 4.6 highlights that this expansion is largely driven by investment funds, whose assets have more than doubled relative to GDP over the same period. By contrast, more traditional institutions such as pension funds and insurance companies have grown broadly in line with global GDP.
4B. CONSEQUENCES
4B.i. The illusion of liquidity masks great risk to Liquidity Dynamics
We see an increased risk that non-committed liquidity providers may withdraw liquidity simultaneously, even if driven by different underlying reasons.
On the surface, the rise of non-bank liquidity providers can be seen as an enhancement. However, when considering that some of these providers have no clients, only counterparties, and hence no commitment, it raises the question about the sustainability of these liquidity conditions. In case of rising volatility, we believe these providers of liquidity could withdraw, if only momentarily, if they consider it to be their best course of action. Their utility function is limited to making money and making it soon. Bank utility functions are a lot more complex and balanced and include, for example, the necessity to preserve their reputation and to serve clients. They also have a much longer investment horizon.
Quant strategies trade primarily to extract information and capture signals, not to intermediate risk. As a result, they function as non-committed liquidity providers: they supply liquidity when markets are calm but tend to withdraw abruptly when volatility rises. This dynamic contributes to an illusion of liquidity, where spreads appear tight, but underlying market depth is fragile.
4B.ii. Increased complexity intensifies systemic risks
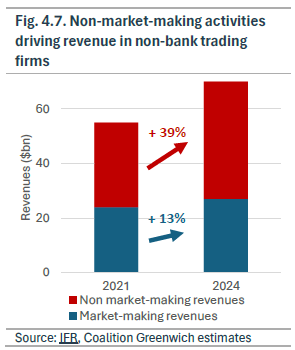
Market Makers, thanks to their colossal investment in people and technology, have stepped up to be a major liquidity provider and have gradually taken over some business from banks. Starting with the high volume / low margin part of the business, market makers have moved higher in the complexity chain and are now expanding their business to and prop trading and structured products.
According to IFR, nearly 70 percent of Jane Street’s revenues now come from proprietary trading. This shift illustrates a broader change in the business model, where market making increasingly serves as a means of extracting information rather than simply capturing bid-ask spreads (Fig. 4.7). With market makers now active in much broader parts of the market the risk for Liquidity Dynamics is no longer contained to listed instruments but also to some more complex products across asset classes and regions.
4B.iii. Prime Brokerage: The contagion channel between non-committed liquidity providers and banks
The growing importance of NBFIs, which include market makers, is a key concern highlighted by the IMF in its 2025 Global Financial Stability Report, titled Shifting Ground beneath the Calm. As NBFIs expand, the IMF notes their increasing reliance on banks for funding, estimating that US and European banks have a combined exposure of 4.5 trillion dollars to these institutions. Figure 4.8 shows that for some US and European banks, exposures to NBFIs reach levels close to six times their Tier 1 capital. Even more troubling, banks with the highest NBFI exposures tend to rely more heavily on wholesale funding for their own liquidity needs, further increasing vulnerability in a stress scenario (Fig. 4.9).
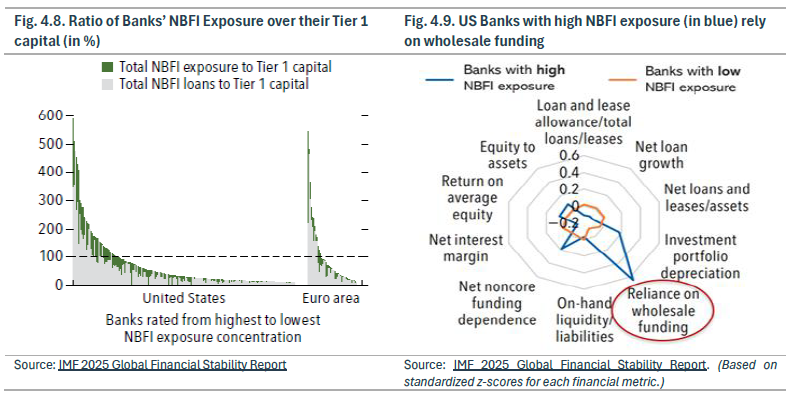
Banks appear more solid than ever and, on the surface, seem better equipped to withstand a systemic shock. However, we believe that the nature of their interconnectedness with NBFIs and the potential channels of contagion are often misunderstood, creating a false sense of resilience. The failure of a large multi-strategy fund or a major market maker would quickly transmit stress to banks through prime brokerage relationships and related financing channels. The IMF estimates that more than 20 percent of European banks could see their CET1 ratios fall by 50 to 100 basis points if NBFIs were to come under severe stress, and roughly 50 percent could experience declines exceeding 100 basis points.
The past decades have seen the rise of market makers and quantitative firms, which we classify as Fragilizers, alongside the relative retreat of banks, which we group among the Stabilizers. This shift in the balance of power is worrisome for Liquidity Dynamics and overall market stability, especially in the event of significant stress. What concerns us is that an increasingly large and complex segment of the financial system now rests on firms with little commitment to market stability, firms that can withdraw abruptly.
Beyond liquidity provision, we also need to consider the systemic risk. It would also be misguided to assume that market makers pose low systemic risk. Their business models have moved higher up the complexity chain, and there is a real contagion channel from them to banks via lending and prime brokerage services, and then from banks to the real economy through lower lending ability.
SECTION 5:
RETAIL AT ALL-TIME HIGH
Non-committed liquidity providers impress by their sheer scale, while retail investors stand out by their numbers. Together, this new group holds enough firepower to influence market direction, making payment for order flow, as illustrated in Figure 4.3, even more consequential. While retail has been a local stabilizing force locally, we explain below why we believe this group presents the characteristics of a Fragilizer.
5A. EVIDENCE
5A.i. Evidence in volumes
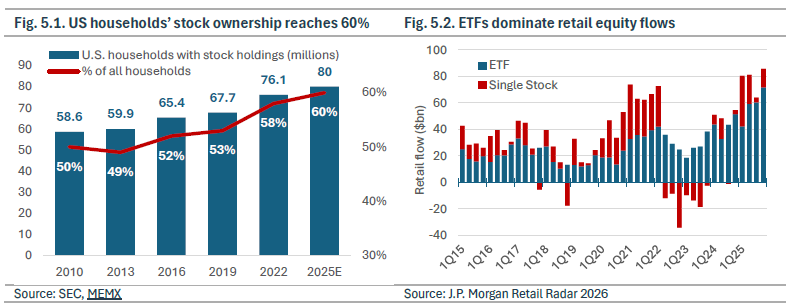
Retail investors accounted for 29 percent of all options activity at the end of last year, up from 23 percent at the start of 2020, according to Bloomberg Intelligence. As shown in Fig. 5.1, 60 percent of US households owned stocks in 2025, the highest level on record. Retail inflows into single stocks and ETFs also reached a ten-year high during the year (Fig. 5.2).
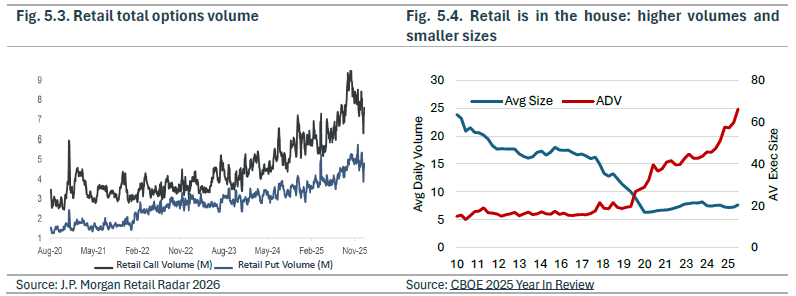
Retail’s influence is also evident across the options market. Retail traders have more than doubled their options activity over the past five years, with a pronounced preference for call options (Fig. 5.3). The CBOE further reports that while overall options volumes are at record highs, the average execution size is at a record low. In our view, this combination reflects the growing importance of retail investors in options markets (Fig. 5.4).
5A.ii. Prime Brokerage: The contagion channel between non-committed liquidity providers and banks
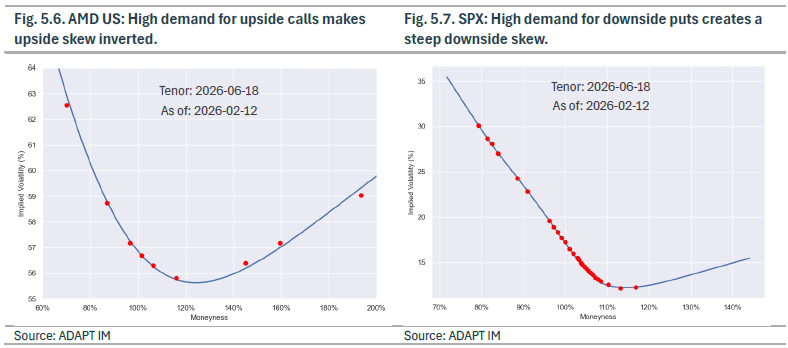
Retail’s impact is also visible beneath the surface: in derivatives pricing. A defining feature of retail options activity is the dominance of upside speculation driven by fear of missing out. Retail traders consistently express bullish views on their preferred stocks by purchasing call options. As a result, implied volatility surfaces for several US technology names have shifted from a traditional skew to a smile, with upside calls trading almost as richly as downside puts in volatility terms. Notably, i) index-option skews remain quite steep, and ii) upside calls on single stocks were historically dominated by call-overwriting programs, making the recent shift even more remarkable (Fig. 5.6 and 5.7).
5B. CONSEQUENCES
5B.i. BTD: a local stabilizer but a growing risk to Liquidity Dynamics
Retail traders can no longer be dismissed. Advances in technology, frictionless access to markets and a collective mindset amplified by social platforms have turned retail flows into a force capable of moving markets in ways that would have been unthinkable a decade ago. This dynamic accelerated during the Covid lockdowns and has persisted in a regime defined by low volatility, steadily rising asset prices, and only brief, shallow drawdowns. In such an environment, maintaining long exposure and systematically buying the dip (BTD) has been consistently rewarded.
As a result, retail investors now command more capital than ever and operate with a trading psyche deeply ingrained in this strategy. In that sense, BTD resembles a martingale: it appears reliable as long as capital is available but inevitably fails once that constraint is reached. Over a sufficiently long horizon, its expected value converges to zero. A recent illustration is the roughly $50 million loss incurred by a retail trading community following the “Captain Condor” episode (source: Morningstar).
Crucially, when this market configuration reverses, the implications for Liquidity Dynamics can be severe. The same cohort that previously provided consistent bid-side support and helped stabilize markets during shallow drawdowns can abruptly withdraw or become forced sellers. At that point, liquidity does not merely fade, it flips, adding to supply and creating highly unbalanced, fragile market conditions.
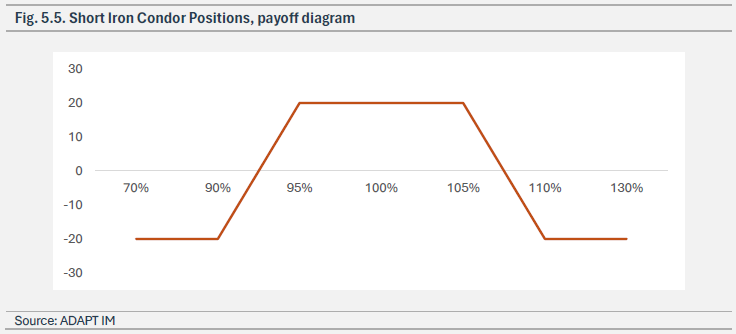
Box 5. “Captain Condor”: How a short S&P 500 volatility martingale led to a near-$50m wipeout
Despite the name, Captain Condor was no superhero. Still, he captured a sizable retail following by promoting options trading strategies to a mass audience. He sold day-trading advice to retail investors and earned his nickname from his signature trade, the iron condor. The strategy, constructed from a call spread and a put spread, profits if the underlying remains within a defined range, as shown in the payoff diagram (Fig. 5.5).
While the payoff itself is not inherently flawed, the implementation proved fatal. Followers systematically applied a martingale approach, doubling position sizes after each large move in the S&P 500. The result was a rapidly compounding short-volatility exposure that ballooned into an unsustainably large aggregate position. On the 24th of December 2025, an index move of less than 50 bp was sufficient to trigger losses of tens of millions of dollars, driven by a toxic mix of leverage, thin liquidity, and extreme position sizing.
5B.ii. Contagion risks from Wall Street to Main Street
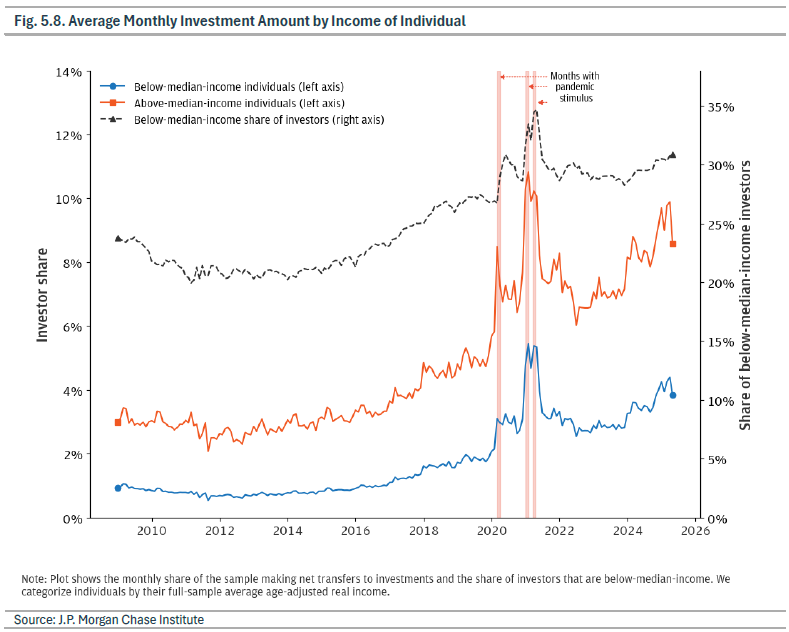
According to the J.P. Morgan Chase Institute and as illustrated in Fig. 5.8, the growth in retail participation extends well beyond high-income households and now includes a significant share of lower-income individuals. Excluding the temporary effects of pandemic-era fiscal stimulus, the proportion of investors with below-median income is at its highest level since the Global Financial Crisis. While the amounts invested by these households are individually small, their rising exposure raises concerns about financial resilience. Higher-income and upper-middle-income households typically have the buffers necessary to withstand market losses. In contrast, lower-income investors may lack such protection, increasing the risk that a downturn could erode lifetime savings and force meaningful reductions in consumption. In aggregate, these dynamics could affect broader economic activity and social cohesion.
Retail investors are emerging as potential Fragilizers.
We need to give credit to retail. As a group, it navigated particularly well in recent years, often with an acumen superior to most professionals. However, we bucket the retail community among the Fragilizers for at least two reasons. First, it remains largely unknown how this investor cohort will behave in a sharp and prolonged market downturn driven by a real fundamental change (i.e. a new piece of information that makes one’s view of the world change significantly) rather than driven by technical considerations (the world has not changed, only asset prices). The buy-the-dip mentality is a double-edged sword: while it has acted as a stabilizing force during short-lived corrections, in a more severe dislocation it could become a loss accelerator, amplifying rather than dampening volatility.
Second, in a true bear market, retail trading losses could have meaningful repercussions for the real economy. The wealth effect generated by the recent bull market has created a powerful virtuous circle. Households increasingly rely not only on income, but also on the additional wealth produced by rising equity markets, to support their lifestyle and consumption. This self-reinforcing cycle of higher markets and higher spending is beneficial on the way up. But an abrupt reversal could turn into a dangerous transmission mechanism from Wall Street to Main Street, with a sharp equity decline quickly translating into lower consumption and broader economic stress.
SECTION 6:
SOVEREIGN AUTHORITIES’ DRY POWDER AT ALL-TIME LOW
Having examined five of the seven trends, the conclusion is clear. Fragilizers have gained ground, while traditional Stabilizers have receded. We now turn to the Stabilizers of last resort, sovereign authorities, namely central banks and governments. Here too, the picture is deteriorating. Over the past five years, their room for maneuvering has narrowed, and in some cases, their credibility has weakened.
6A. EVIDENCE
6A.i. Rising level of debts
Debt has become an unsolvable problem. There is neither political appetite nor economic capacity to reduce fiscal deficits. Running such high deficits outside of an economic crisis or wartime is unprecedented, yet discontent among the lower deciles of US households remains extremely high. The University of Michigan’s consumer sentiment index highlights a striking divergence: individuals with investment portfolios feel materially better about the economy, while sentiment among non-stockholders has fallen to its lowest level since the survey began in 1998.
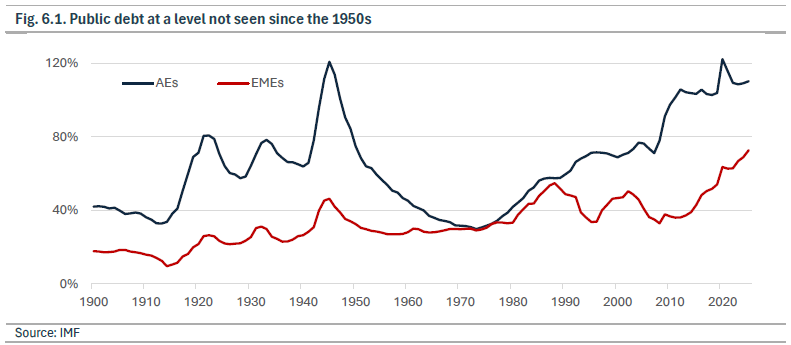
The IMF estimates that both emerging and advanced economies are now exhibiting cycle-high levels of public debt relative to GDP (Fig. 6.1). Advanced Economies (AEs) have not been this indebted since the 1950s, and Emerging Market Economies (EMEs) have simply never carried such large debt burdens.
In these conditions, governments will find it increasingly difficult to rely on debt as a tool to stimulate growth or to act as a backstop in the next crisis. Markets may be unwilling to absorb the required volume of new issuance, and in many cases the remedy may prove more damaging than the problem itself. Ultimately, there are only two realistic paths out of this paradigm: inflation and financial repression.
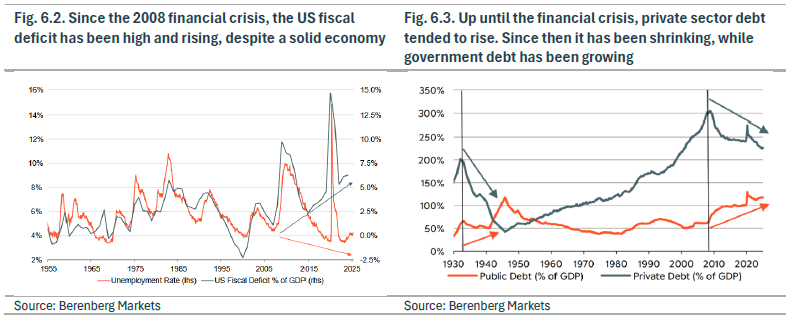
The US fiscal deficit is now approximately 6% of GDP, reaching levels not seen since the Global Financial Crisis. An ageing population, expanding social and ecological policies, and higher defense spending have significantly increased public financing needs. Although the H.R. 1 (“One Big Beautiful Bill”) of the Trump administration was intended to reduce public spending, fiscal deficits are not expected to decline materially in the coming years. Historically, the U.S. fiscal deficit was closely correlated with economic conditions, particularly employment, yet a structural break emerged around 2015, with deficits rising despite a solid economy (Fig. 6.2).
With rising debt levels, the U.S. government is increasingly absorbing macroeconomic risk relative to private markets (Fig. 6.3). Since the Global Financial Crisis, public debt has expanded alongside a contraction in private sector leverage, a configuration that has not been observed since the 1930s and 1940s, in the aftermath of the Great Depression and WW II (source: Berenberg Markets, Unstoppable Government Debt).
6A.ii. Erosion of central banks’ credibility
Central bank credibility has declined over the past decade, with erosion accelerating in the past five years. Years of unconventional monetary policy, including negative interest rates and quantitative easing, have been perceived by many market participants as fostering moral hazard. This new monetary regime, defined by ultra-low rates and seemingly unlimited demand for debt, has incentivized governments to expand deficits and issue unprecedented levels of debt, rather than pursue fiscal discipline and balanced budgets.
In a working paper published in 2024, the ECB notes that this credibility has eroded further after the pandemic, largely due to three key factors: first, the post-pandemic inflation surge pushed inflation far above target levels, exposing a clear failure to meet mandates. Second, central banks persistently underestimated inflation in their forecasts, damaging their reputation as reliable, expert institutions. Third, inconsistencies in forward guidance, with some banks raising rates earlier than their own guidance, weakened confidence in their communication tools. Despite this, the subsequent disinflation process proved easier than the previous one in the seventies, partly reflecting still relatively well-anchored expectations and residual trust. Overall, the ECB emphasizes that trust, rather than popularity, is fundamental to effective monetary policy, helping anchor expectations, reduce uncertainty, and shield central banks from political pressure. This trust remains fragile, difficult to measure, and increasingly challenged by structural forces such as polarization, social media, and misinformation.
6B. CONSEQUENCES
6B.i. Higher rates make new debt issuance and budget deficit more dangerous
The stronger this interconnectedness, the higher the risks to financial stability, particularly as high public debt reduces the government’s capacity to intervene in support of ailing banks. The Swiss case of Credit Suisse illustrates how strong public finances can help contain the impact of the failure of a major bank institution. Switzerland’s financial stability allowed the government to provide credible guarantees to its competitor UBS in the acquisition process, stabilizing market confidence and limiting the effects on the whole financial system.
Given the existing stockpile of debt and the current level of interest rates, governments have far less capacity to issue new debt to support the economy in the event of a recession or financial crisis. Their role as Stabilizers of last resort is therefore significantly weakened, and their ability to inject liquidity and stabilize Liquidity Dynamics in times of stress materially reduced.
6B.ii. Credibility destruction curbing central banks’ power
Central banks have significantly expanded their toolbox over the past decades. However, without credibility and trust all these tools become mostly irrelevant. In October 2025 the International Journal of Central Banking published a working paper titled Central Bank Credibility and Institutional Resilience and the conclusion drawn is clear: diminished credibility can amplify market instability, erode confidence in financial institutions, and increase the risk of disorderly adjustments, as highlighted by the growing sensitivity of markets to structural fragilities and volatility dynamics. The paper highlights three critical channels through which declining credibility weakens central banks’ effectiveness and deteriorates market conditions. First, it weakens the anchoring of expectations, increasing uncertainty and making inflation and financial conditions more volatile. Second, it reduces the effectiveness of monetary policy tools, particularly forward guidance, which relies entirely on trust to influence behavior. Third, it undermines central banks’ ability to stabilize markets in times of stress, as their actions are more likely to be questioned or ignored.
High public debt levels have implications for the yield curve, which has steepened and pushed long-term interest rates higher. Persistently rising public debt has increased concerns that inflation and financial repression may be the only way to restore debt sustainability in the long run. These concerns have increased the fear of a debasement of the US Dollar and contributed to rising demand for real assets such as gold, even in an environment of higher interest rates — marking a structural break in 2022 in the traditional relationship between interest rates and gold prices (Fig. 6.4).
As discussed by the IMFs, elevated public debt levels are worsening the bank sovereign nexus, defined as the interconnectedness between a country’s banking system and the financial health of its government.
With limited dry powder remaining and reduced credibility, the potential for sovereign authorities to act as Stabilizers of last resort has decreased, with severe consequences for Liquidity Dynamics in times of crisis.
Looking across the first six trends, a clear picture emerges: Fragilizers have gained ground while Stabilizers have receded. This shift in market structure is materially weakening Liquidity Dynamics.
The risk is even more acute in a full-blown crisis, when the traditional Stabilizers of last resort may themselves face constraints in providing liquidity precisely when it is most needed. In such a scenario, interventions risk becoming counterproductive, making the existing problems even worse.
SECTION 7:
LEVERAGE AT CYCLE-HIGH
We are now dealing with six trends that have moved to all-time highs. At the same time, leverage across the system is building toward local heights. This is a dangerous mix because if leverage never triggered a real crisis on its own, it always provides more fuel for the fire. It leaves Liquidity Dynamics increasingly vulnerable. This increases the risk that the next significant fundamental (real) shock triggers not only a healthy commensurate correction but also an unorderly breakdown.
7A. EVIDENCE
We find ample evidence of a broad-based increase in leverage across the financial system. Leverage can take many different shapes, which share two common characteristics: 1. It makes the actual risk look smaller than it really is. 2. It amplifies the impact of idiosyncratic shock on balance sheets, leading to contagion, and giving potential to idiosyncratic shocks to become systemic shocks. In this document we pick four very different examples to illustrate this trend but there are countless more.
7A.i. Heightened derivatization of the world
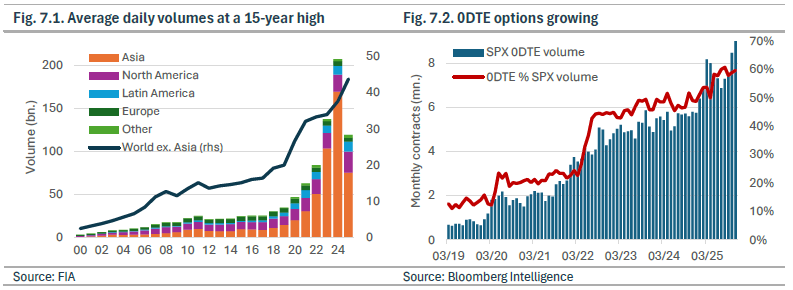
Derivatives trading is reaching new heights across every segment of the market. From 0DTE options to OTC structures, and from retail investors to banks and institutional players, activity levels are breaking records. Fig. 7.1 shows that the last three years registered the highest derivatives trading volumes ever. A major contributor to this surge is the rapid adoption of same-day expiry options (Fig. 7.2), which have attracted a remarkably broad range of market participants over the last five years.
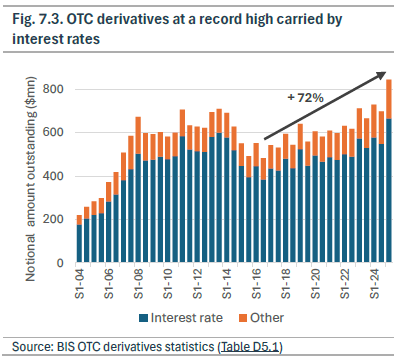
OTC derivatives have expanded just as aggressively, in some cases even outpacing exchange-traded products. In credit markets, risk.net reports that US systemic banks saw a 20% increase in CDS trading volumes in the third quarter of 2025, with total notional protection bought and sold reaching a decade high. Interest rate derivatives remain the largest component of OTC activity; notional volumes reached 123.5 billion dollars in the second quarter of 2025 (Fig. 7.3).
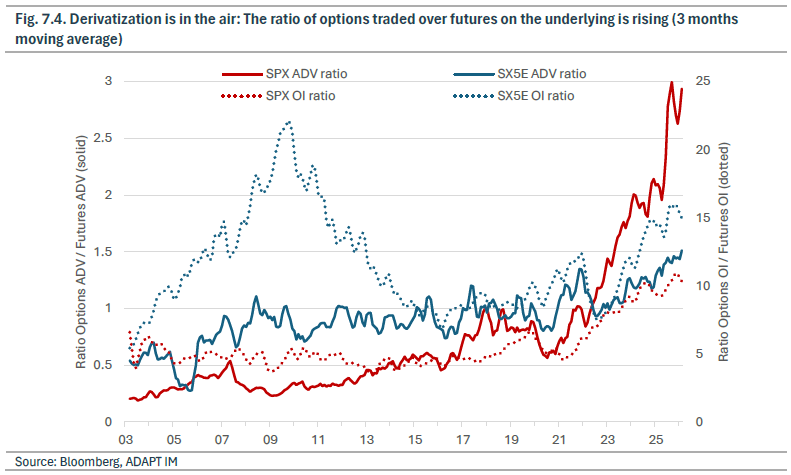
This clear growth in derivative products is not, however, accompanied by the same growth in the underlying securities. In many cases, it has simply become easier to buy an option than to buy the underlying itself.
7A.ii. Increasingly complex ETFs
The derivatization of markets is not the only evidence that leverage and speculation are back to high levels. Financial engineers are creating new products and financial solutions to minimize costs and maximize returns, increasing overall complexity and favoring speculation.
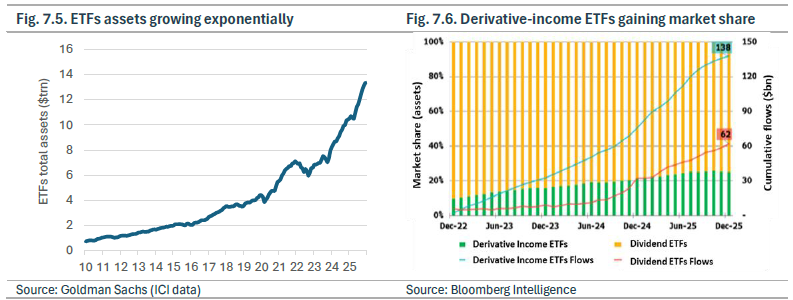
In the last five years, the growth of ETFs has allowed financial engineering to move beyond large banks and institutional investors and become accessible to a broader range of individuals and institutions. We estimate that there is now 5000 ETF listed in the US, about 25% more than there are listed single stocks. A striking example of this rise is derivative-income ETFs. Bloomberg data show that over the past five years, derivative-income ETFs have been growing faster than traditional dividend ETFs (Fig. 7.5 and 7.6). Among them, autocallable ETFs, first launched in June 2025, are following the growth trend. The first product, the Calamos Autocallable Income ETF (CAIE), gathered $500 million in assets within six months, a success that encouraged other providers to launch similar products, with several now in the SEC pipeline (source: Bloomberg, CAIE: Flows and Competition). Autocallable strategies combine a bond component with the sale of downside options. Investors receive coupons if the underlying stays above a predefined barrier, but they bear losses if it falls significantly below that level. Once reserved for sophisticated investors due to their complexity, high costs and relative illiquidity, the ETF packaging is democratizing it. Leveraged ETFs also deserve a mention.
7A.iii. AI Financing overengineering at all-time high
Another example where leverage is used to mask the actual risk is evident in the AI sector. The recent sector boom is driven by massive capital expenditure to build data centers and boost computing capacities. This growth relies on more complicated vendor financing arrangements, with even circularity and a greater reliance on debt finance.
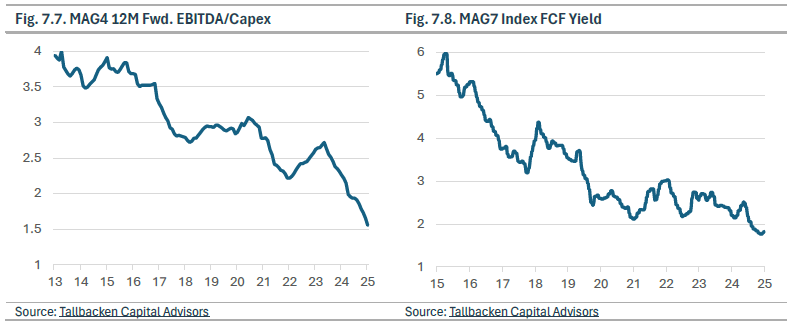
The shift towards long-term investment is visible in Figure 7.7 and 7.8. The declining forward EBITDA-Capex ratio for the Magnificent 4 (Alphabet, Amazon, Meta, and Microsoft), indicates that these firms’ investment needs grow faster than their operating income, suggesting an increase in long-term investments such as those for data centers. The decrease in FCF yield for the Magnificent 7 (Alphabet, Amazon, Meta, Microsoft, Nvidia, Apple, and Tesla), also indicates the rising difficulty of self-financing projects.
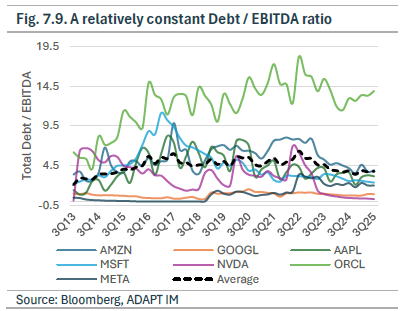
However, traditional on-balance sheet debt did not rise in proportion to the expected investment needs, as shown by Figure 7.9. This suggests that at least part of the financing comes from more complex structures that are off balance sheet. Leading companies such as Meta, Oracle and xAI are increasingly moving away from traditional financing models and adopting more complex financial engineering solutions tailored to the long-term and capital-intensive nature of AI infrastructure. A key objective of these structures is to ringfence project-specific risks rather than allowing them to affect the company’s broader balance sheet.
As reported by the Financial Times (cf. Tech groups shift $120bn of AI data centre debt off balance sheets), many tech companies are now using Special Purpose Vehicles (SPVs) to fund large-scale data-center construction. By channeling financing through SPVs, firms can isolate the risk of individual projects, protecting the rest of the business from potential downside. These arrangements have been made possible by strong investor demand, driven by expectations of exceptionally high future returns. According to the Financial Times, at least 120 billion dollars has already been raised by tech companies through SPVs with major asset managers and US banks. What has now become the norm “would have been unfathomable 18 months ago” said a senior executive at one of the large financing institutions to the FT. SPV financing also enables companies to raise additional capital more easily. Because the associated debt does not appear on the parent company’s consolidated balance sheet, it preserves borrowing capacity for further traditional debt issuance. For example, Meta reportedly secured roughly 30 billion dollars in October 2025 from asset managers and private-market institutions through an SPV, with the debt remaining off balance sheet. Only weeks later, Meta was able to raise an additional 30 billion dollars in the corporate bond market, securing the liquidity needed to fund its investment commitments.
7A.iv. Payment-in-Kind (PIK)
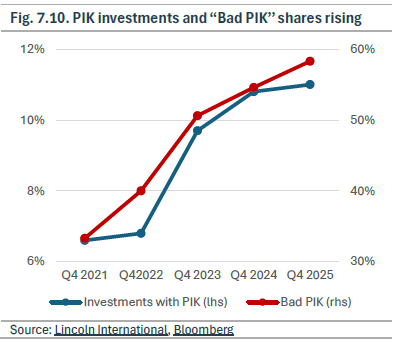
Another form of financial engineering increasingly common in private markets involves modifying the structure of debt rather than relocating it off the balance sheet through Payment-in-Kind (PIK) provisions. PIK allows borrowers to defer cash interest payments by capitalizing interest and adding it to the loan principal. According to Lincoln International, the share of investments incorporating PIK features has nearly doubled over the past four years, now accounting for 11% of private market investments. The report distinguishes between loans structured with PIK at origination and those that subsequently adopt PIK features — so-called “Bad PIK” — whose share has also increased (Fig. 7.10).
7B. CONSEQUENCES
7B.i. Derivatization indicated a more spectaculative mood, contributing to greater fragility
This growing reliance on derivatives represents a gradual, relentless, and profound shift in market structure. As derivatives specialists, while we welcome broader adoption of derivatives, the scale of the increase is concerning, particularly because underlying cash markets have not grown proportionally. In our view, this reflects a broader transition from fundamental-driven investing to speculative trading. Fewer investors have a deep understanding of the assets they hold; many maintain exposure primarily out of fear of missing out on further upside. This relative absence of conviction means that nothing will likely hold these positions when the mood turns, potentially creating supply-demand imbalances and deteriorating Liquidity Dynamics.
7B.ii. Heightened ETF complexity increases market fragility
Exchange Traded Funds are allowing individuals to invest and speculate on complex products without a deep understanding of them. The expansion of these strategies increases tail risk, especially during regime shifts and, in the specific case of autocallable ETFs, around barrier levels, potentially raising correlations due to the hedging strategies of ETF providers.
7B.iii. Lower transparency in AI complex financing makes debt markets more risky
The debt issued through SPVs is often repackaged into asset-backed securities (ABS), enabling the redistribution of credit risk across a broad investor base. While these instruments offer investors an opportunity to participate in large-scale data center financing, the underlying risks can be opaque, particularly for those without deep expertise in structured credit. This new financing model also creates an unusually binary risk profile for investors. The AI sector is operating under a winner-takes-all dynamic, where scale and speed are viewed as matters of survival rather than profitability. As a result, traditional economic frameworks are being set aside, and conventional risk-return assessments are losing relevance. The capital requirements for these data centers are so substantial that even the largest technology firms cannot or do not want to finance them solely through their balance sheets. With the true long-term profitability of these projects still highly uncertain, investors face risky binary outcome.
7B.vi. PIKs worsen private credit risk
In a similar vein, PIK increases overall risk by capitalizing interest. PIK provisions increase total debt, potentially altering its quality and raising effective leverage without refinancing. This practice flatters lenders’ reported income by delaying the recognition of borrower deterioration, increasing the potential impact of a sudden repricing and disguising missed interest obligations. Although it can help a company navigate a period of liquidity stress, its widespread use may create future liquidity pressure for lenders, as the reduced cash income from PIK may force them to sell other assets at a suboptimal time.
Box 6. Rising systemic leverage: are we nearing a “Minsky moment?”
The term “Minsky Moment” is derived from Hyman Minsky, a twentieth-century American economist. His core insight was that periods of stability breed complacency and should not be taken at face value; rather, the longer stability persists, the greater the risk of a severe disruption. Prolonged calm encourages leverage and excessive risk-taking, ultimately culminating in a “Minsky moment”: the point at which a seemingly stable system abruptly turns unstable, even as underlying risks have been building steadily in plain sight.
“Stability leads to instability. The more stable things become, and the longer things are stable, the more unstable they will be when the crisis hits.” – Hyman Minsky
We have previously described, in our Risk Premia Framework, how extended periods of stability can generate a self-reinforcing cycle of volatility selling. A key insight is that the longer this cycle persists, the more fragile the system becomes. This dynamic is a clear illustration of Minsky’s theory, and we believe that the seven trends examined here exhibit similar characteristics.
Cycle-high leverage reflects a highly speculative market mood will have a detrimental compounding effect on Liquidity Dynamics.
Speculators have always played a role in market structure by contributing to healthy price discovery. The problem arises when speculators outnumber fundamental investors and begin to drive markets themselves. This shift creates a feverish environment where facts matter less than momentum, and exuberance becomes the dominant force. Market moves can be much larger and completely disconnected from economic realities. This mood continues to prevail in early 2026. We have already witnessed several episodes where participants abruptly withdrew from the market, causing asset prices to free fall. Markets feel increasingly one-sided: when prices rise too much, sellers vanish; when prices fall too much, buyers disappear. In recent weeks, we have seen multiple such liquidity vacuums across JGBs, precious metals, cryptocurrencies, and single-stock equities.
CONCLUSION
A very recent evolution
None of the seven blocks analyzed in this paper were as large during the last recession/asset drawdown (2020) as they are now. They have grown exponentially during the past five years. Naturally, it means that this market structure has produced at best two years of financial data, during which nothing significant happened. It is thus safe to say that this novel market structure has never been truly tested.
An unprecedented situation with serious implications for Liquidity Dynamics
The easiest take away is that looking in the rear-view mirror is unreliable. The mechanisms and chain of events that happened in the past have very little reason to happen in the same way in the future. It means relying on history, past data and back-tests is a flawed approach. Now, what’s the risk-reward and risk-profile of any trade from here, this is obviously the hard part. In this context, a rigorous investment process, live market structure analysis and disciplined risk management are imperative.
While markets have shown relative resilience to recent, modest volatility shocks, there is no way to predict how this new market structure would behave in a severe and prolonged crisis. What is clear is that many of the participants who have grown rapidly in recent years are Fragilizers and are far more likely to withdraw liquidity during stress than to act as shock absorbers, fragilizing Liquidity Dynamics.
Recent illustrations of fickle liquidity came in January, when the Japanese Government Bonds market experienced a sharp dislocation and a near-meltdown triggered by relatively modest trading volumes, or when silver prices faced their worst daily performance ever by free falling more than 30%.
There is no groundbreaking or completely new evidence in this paper. We’re all familiar with all these facts. What is thought-provoking, however, lies in bringing them together and examining them holistically to understand the type of market structure they collectively create. It is striking to see that each of these shifts goes in the same direction with regard to market structure (making it more fragile) and with regard to Liquidity Dynamics (worsening it).
It is possible to disagree with this conclusion. However, one cannot disagree with our analysis that this market structure is completely new and untested. It will hence necessarily react differently during the next crisis than in previous ones.
Authors:
Date of publication:
Alexis Maubourguet, CIO of ADAPT IM
Clément Mary-Dauphin, CEO of ADAPT IM
March 2026